
We know the MySQL Shell is the advanced client tool for communicate to the MySQL server . MySQL Shell has lot of features like InnoDB Cluster control , InnoDB ReplicaSet, MySQL Shell utilities , MySQL server management etc … Today I came to know, MySQL shell helps lot in monitoring as well ( query, threads, resource consumption , locking ) .
In this blog I am going to explain how to use the MySQL Shell for monitor your server .
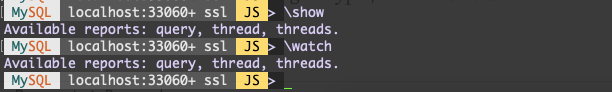
MySQL Shell provides two hot commands \show and \watch for monitor the MySQL server and report generating purpose .
\show : Execute the report with the provided options
\watch : Execute the report in loop with provided options
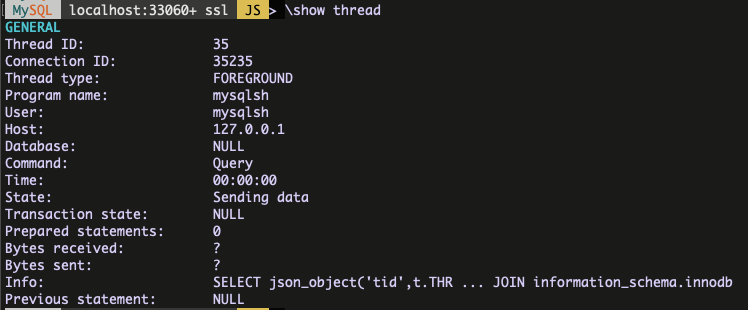
\show with thread example :
\show with query example :
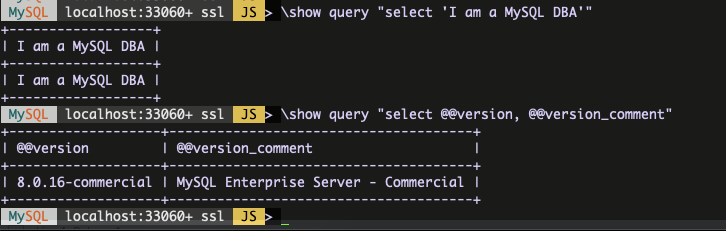
You can execute any query within the double quotes .
\show with threads example :
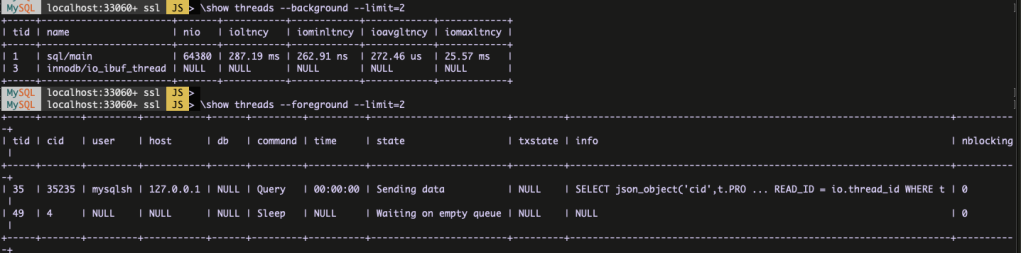
As I showned in the screenshot there are two types in threads .
- –foreground
- –background
Similarly you can use the \watch command to execute the reports in loop .
All good, now I am going to show some examples,
- How to find the top three MySQL threads which consuming more memory for the particular user ?
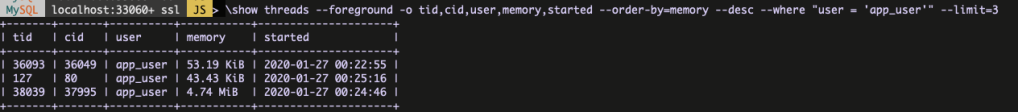
tid : thread id
cid : connection id
memory : the number of bytes allocated by the thread
started : time when thread started to be in its current state
user : the user who issued the statement, or NULL for a background thread
cmd : \show threads –foreground -o tid,cid,user,memory,started –order-by=memory –desc –where “user = ‘app_user'” –limit=3
2. How to find the blocking and blocked threads ?
Consider I started the below transaction in a terminal 1 but not committed ,
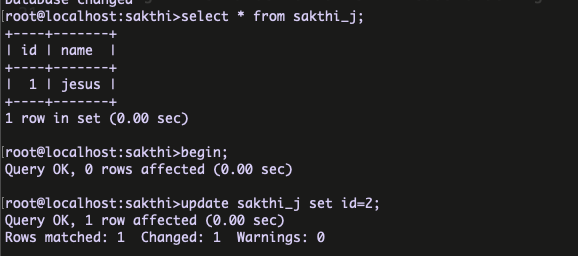
At terminal 2, I am trying to update the same value ,
root@localhost:sakthi>update sakthi_j set id=10;
now, lets execute the \show with the required options ,

tidle : the time the thread has been idle
nblocked : the number of other threads blocked by the thread
nblocking : the number of other threads blocking the thread
After commit the transaction there is no blocking transactions . Make sense ?
cmd : \show threads –foreground -o tid,cid,tidle,nblocked,nblocking,digest,digesttxt –where “nblocked=1 or nblocking=1”
3. How to find the top 10 threads, which used huge IO events ?
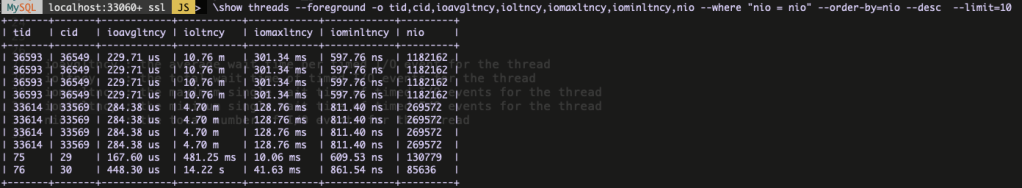
ioavgltncy : the average wait time per timed I/O event for the thread
ioltncy : the total wait time of timed I/O events for the thread
iomaxltncy : the maximum single wait time of timed I/O events for the thread
iominltncy : the minimum single wait time of timed I/O events for the thread
nio : the total number of I/O events for the thread
cmd : \show threads –foreground -o tid,ioavgltncy,ioltncy,iomaxltncy,iominltncy,nio –order-by=nio –desc –limit=10
Like this way, you can find more details about query statistics , JOIN informations , system resource utilisation etc …
I hope this blog will helps someone who is looking MySQL Shell for effectively handle the MySQL server . Will come up with my next blog soon …
Thanks !!!

Good
LikeLike
How To Upgrade MySQL 5.5 To 5.6/5.7 Or MariaDB 5.5 To 10.X On Linux Plesk?
https://velaninfo.com/rs/techtips/upgrade-mysql5-5-to-5-6-5-7/
LikeLike